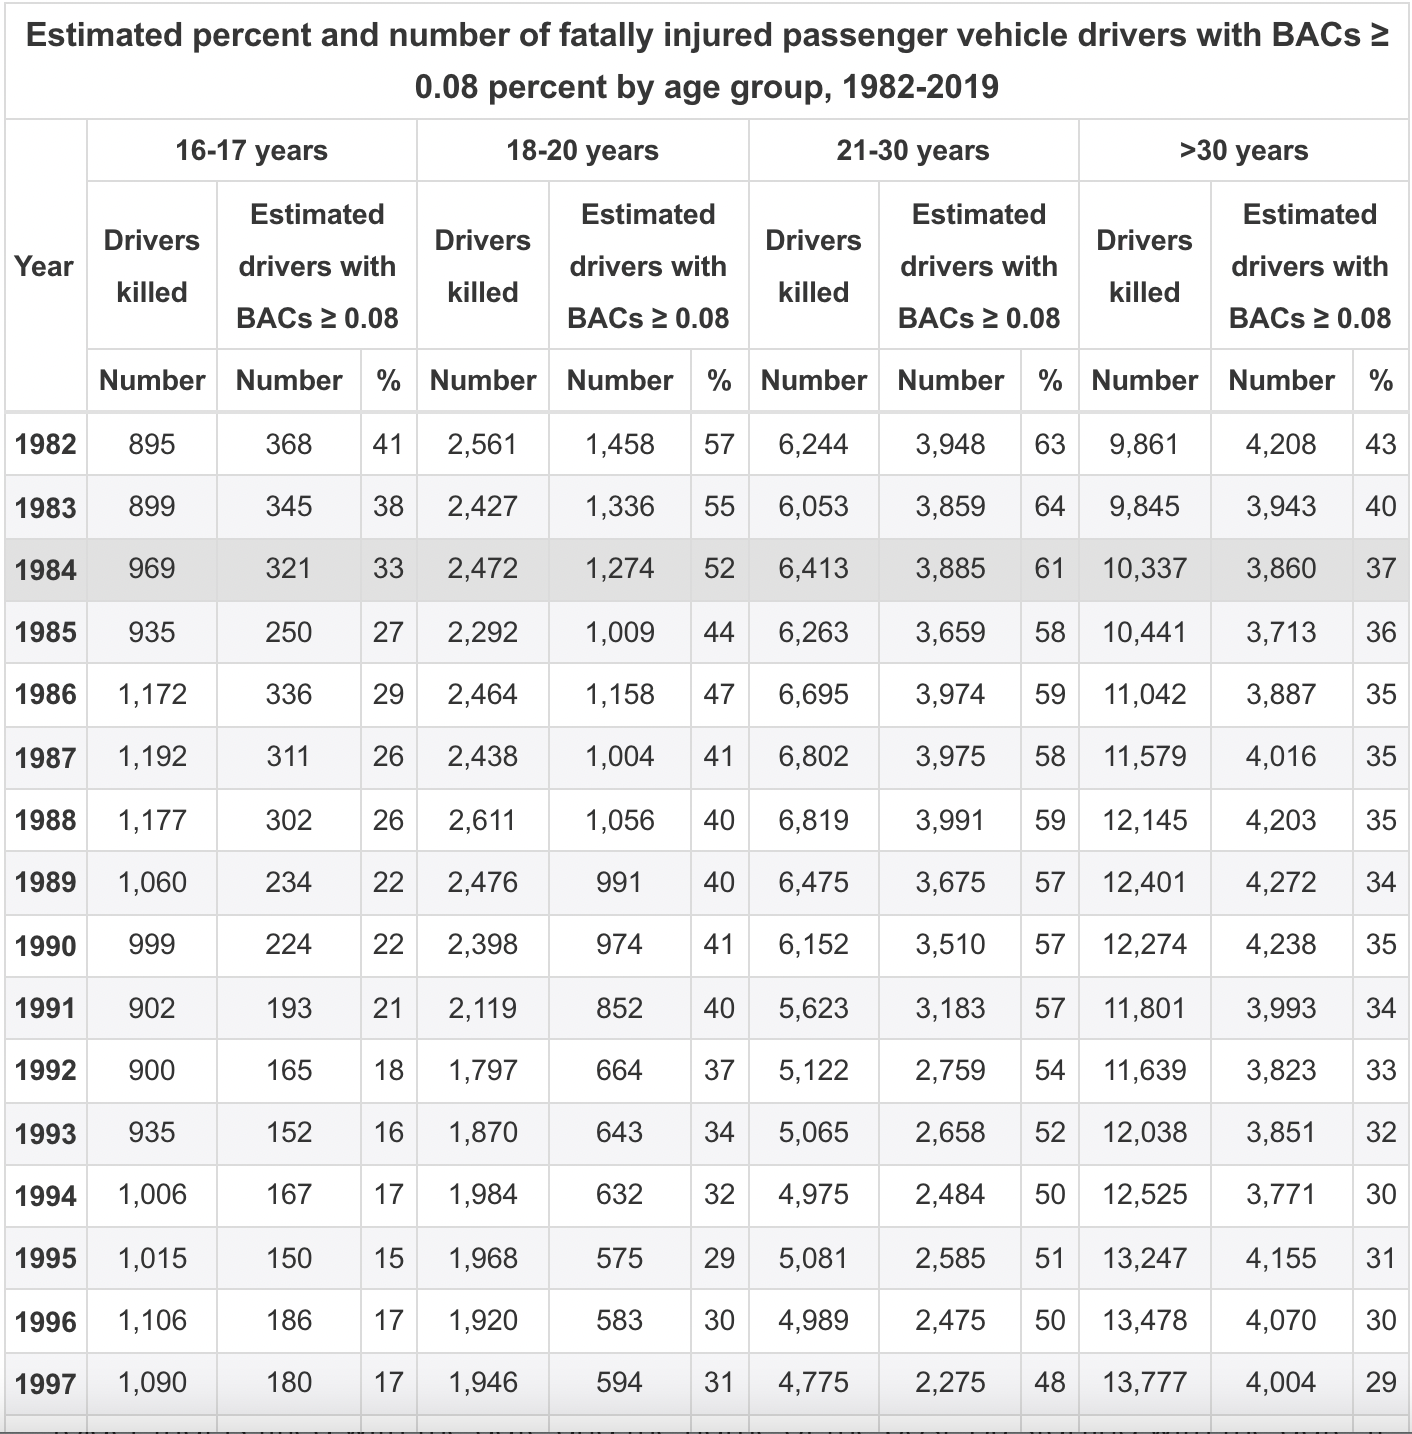
I got my data from this table that is on the website: https://www.iihs.org/topics/fatality-statistics/detail/teenagers#trends
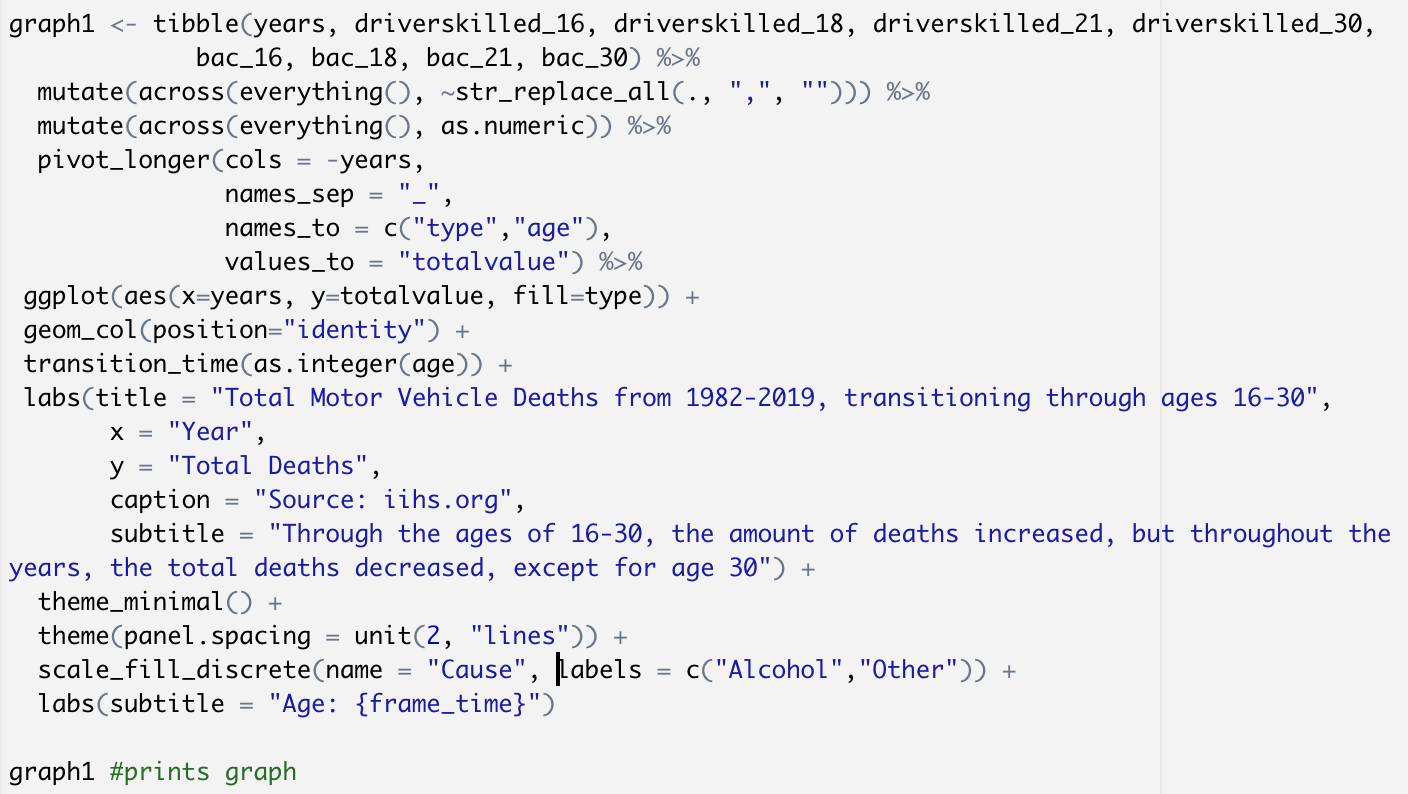
Graph 1:
Using the data in the table, I first got the Total deaths and amount of people who were drunk driving per age group and organized it in a table:
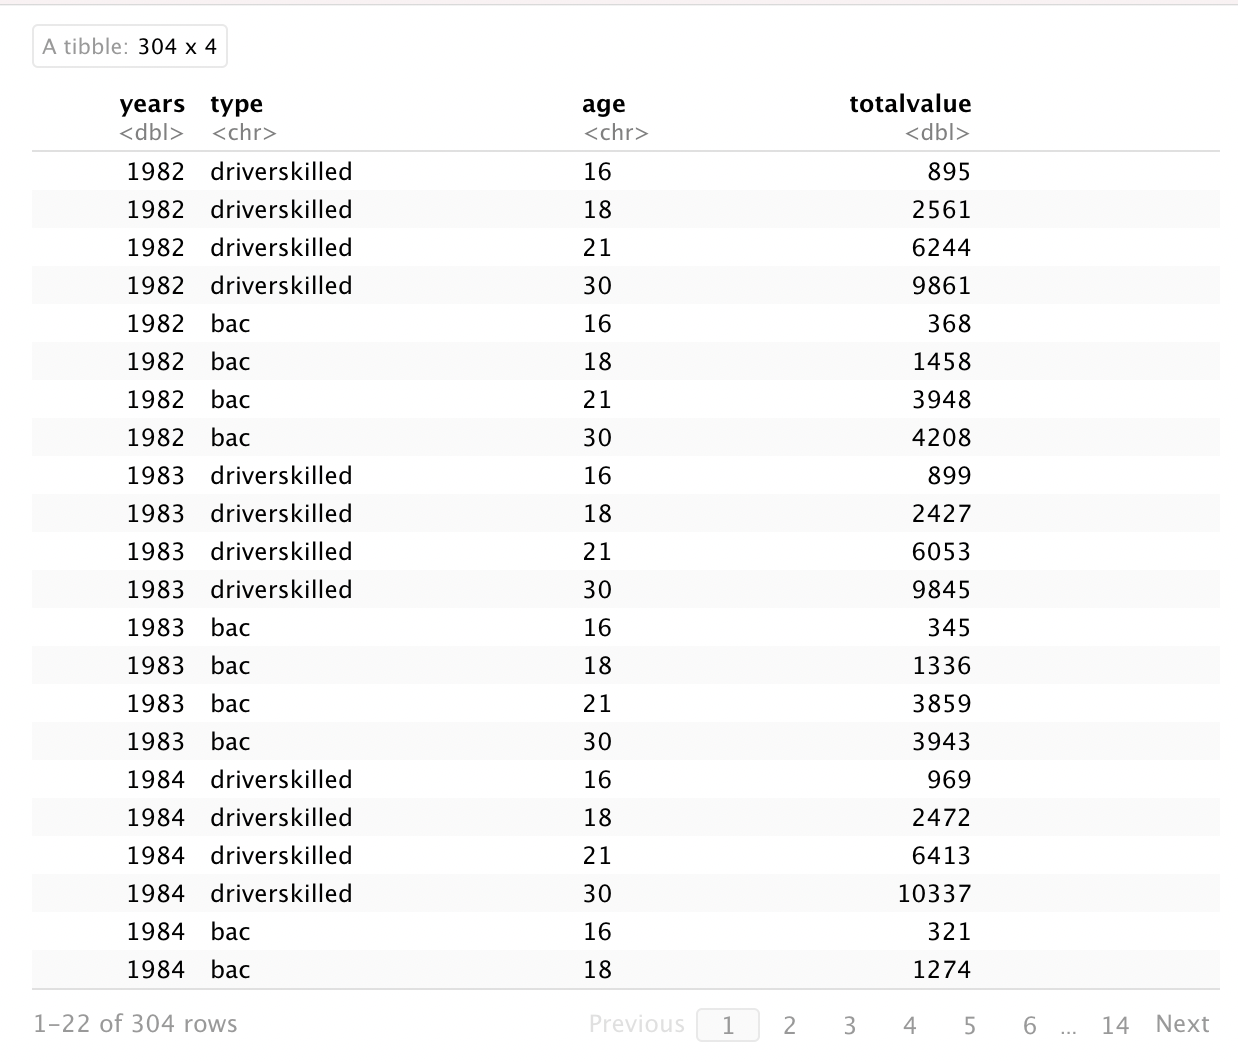
Then I used the following code to graph and implement transitions to the graph:
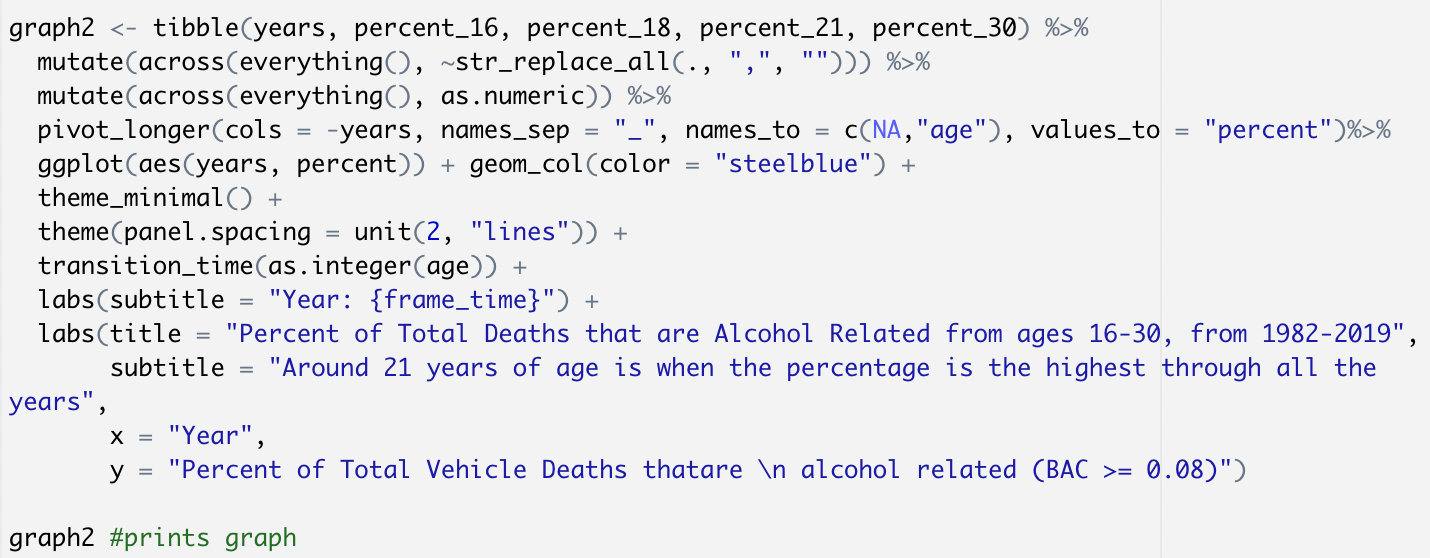
Graph 2:
For graph 2, I took the same approach, but this time I used the percent of Total Deaths that were caused by Drunk Driving and organized it into a table that is sorted by age and year:
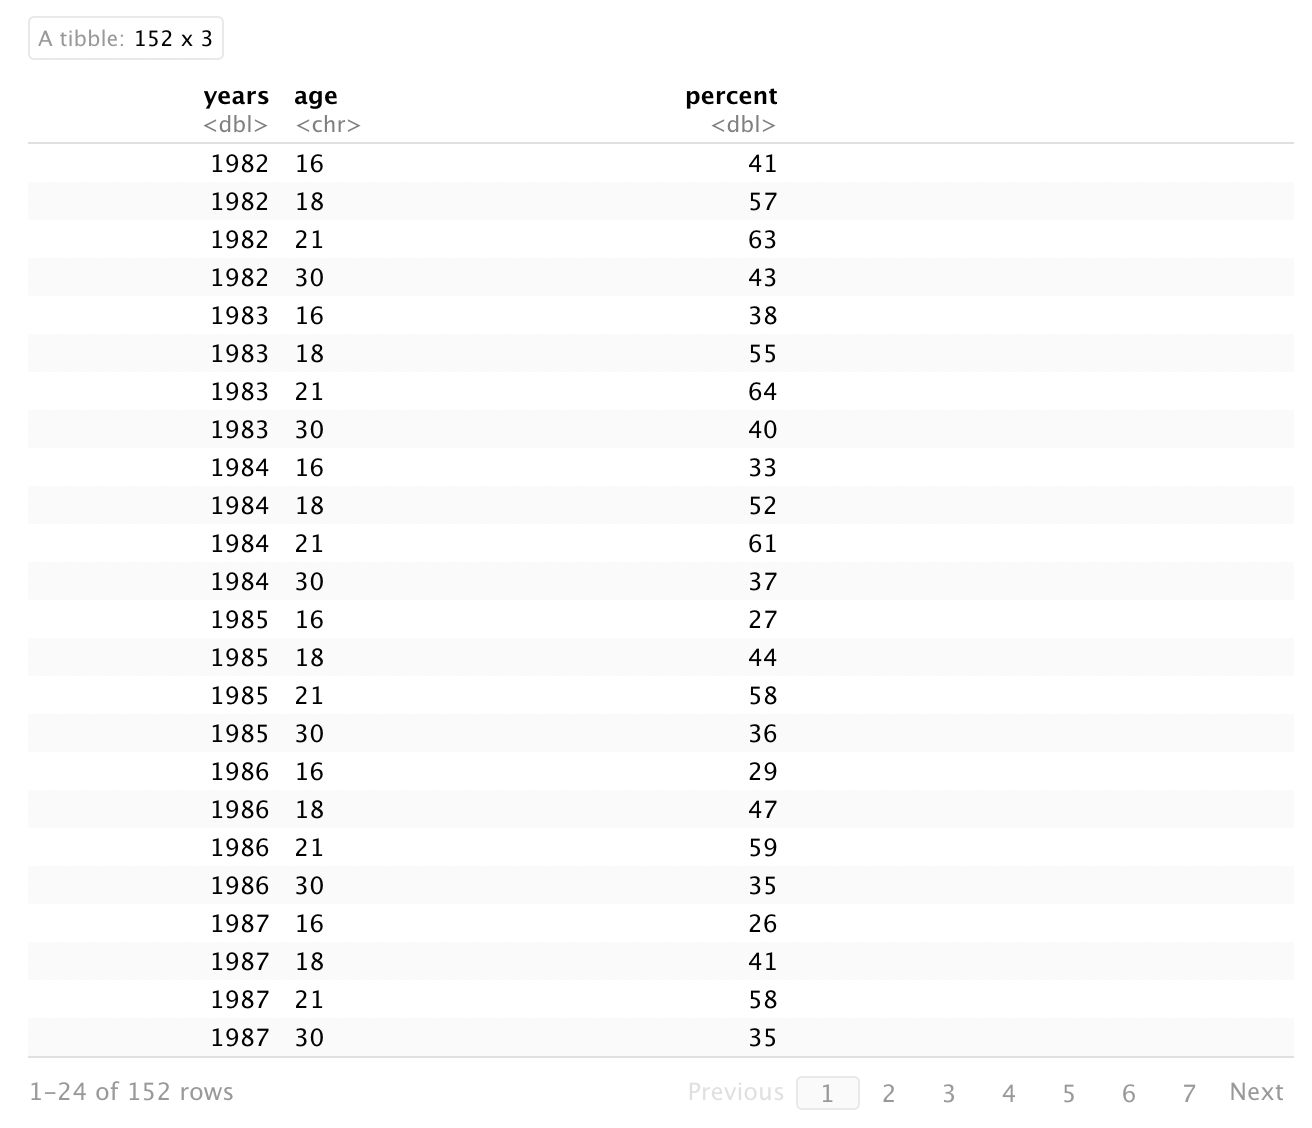
Using the following code, I graphed using age as a variable for the transitions: