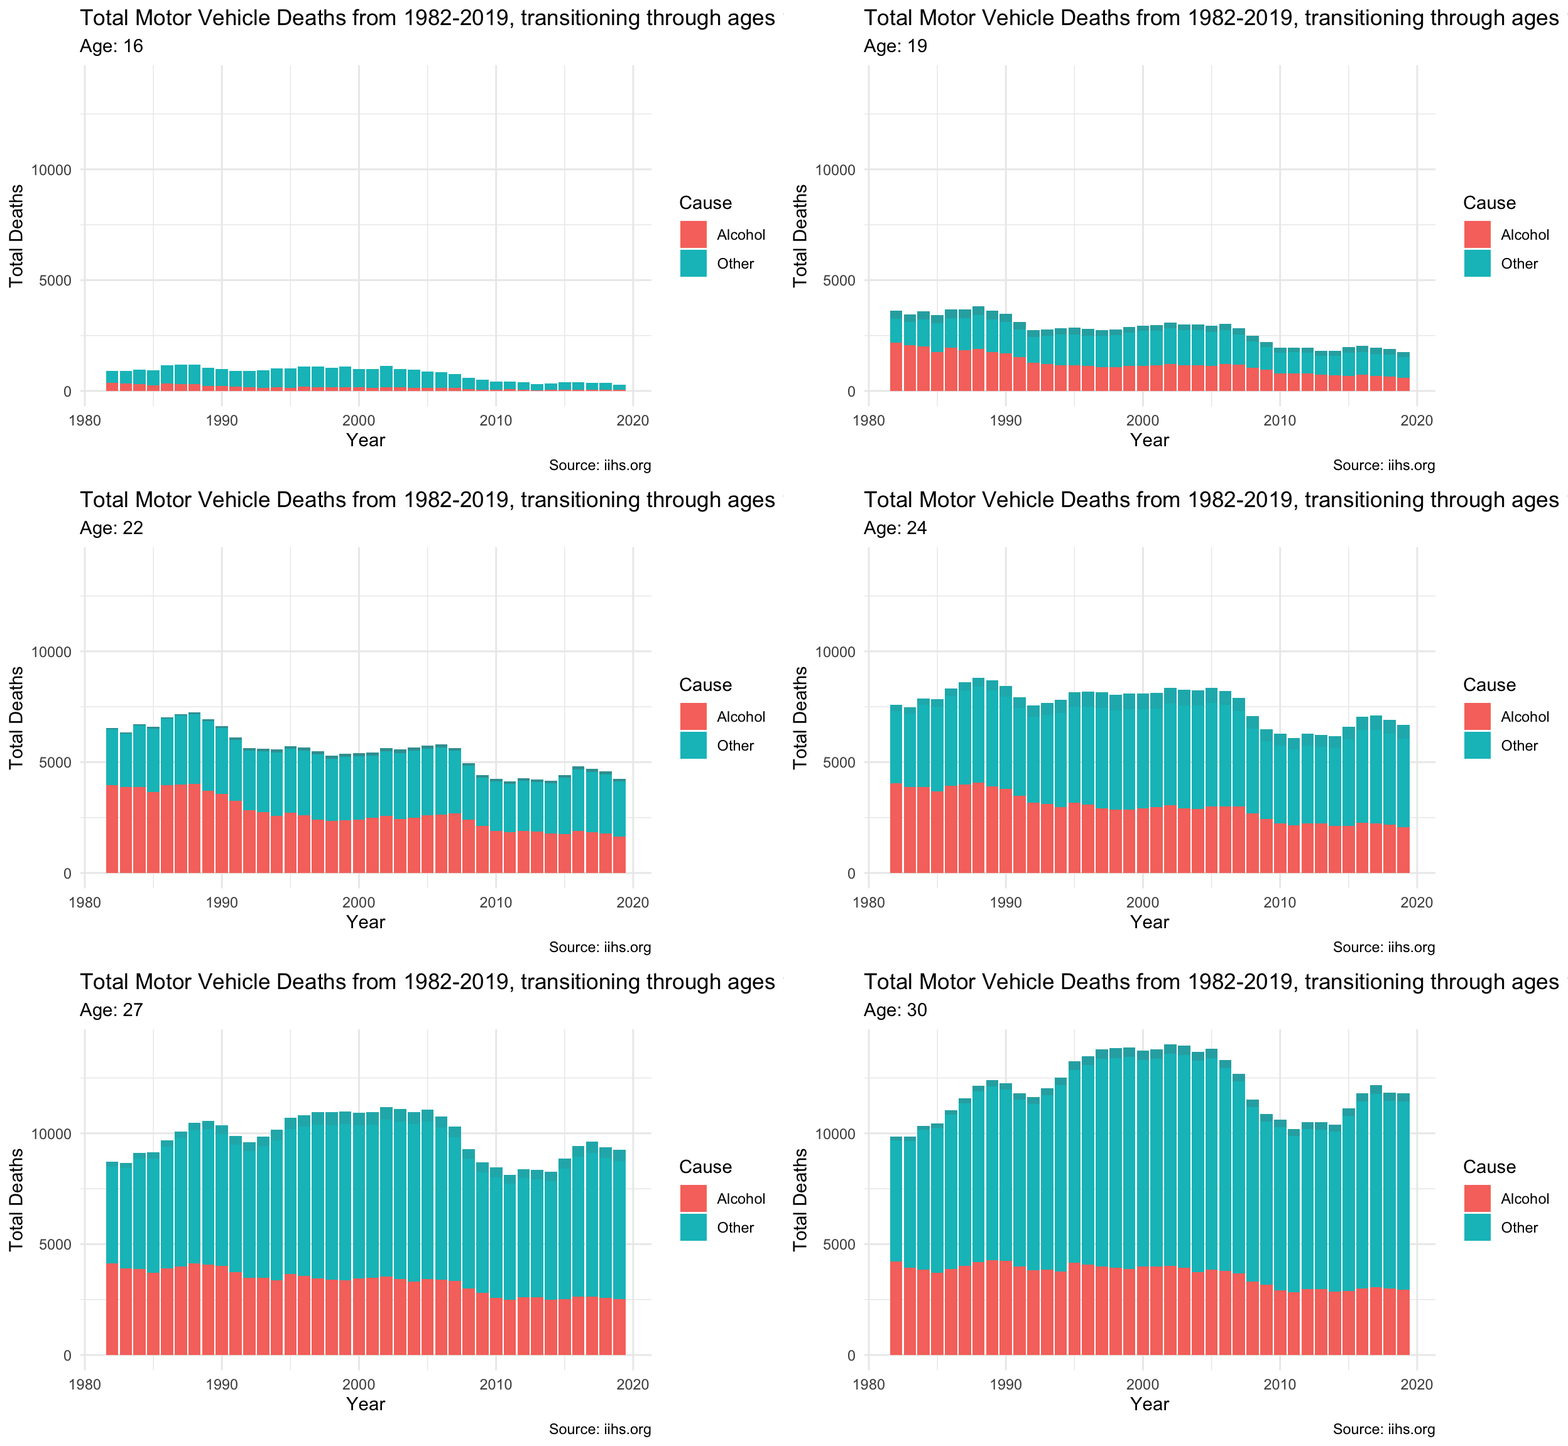
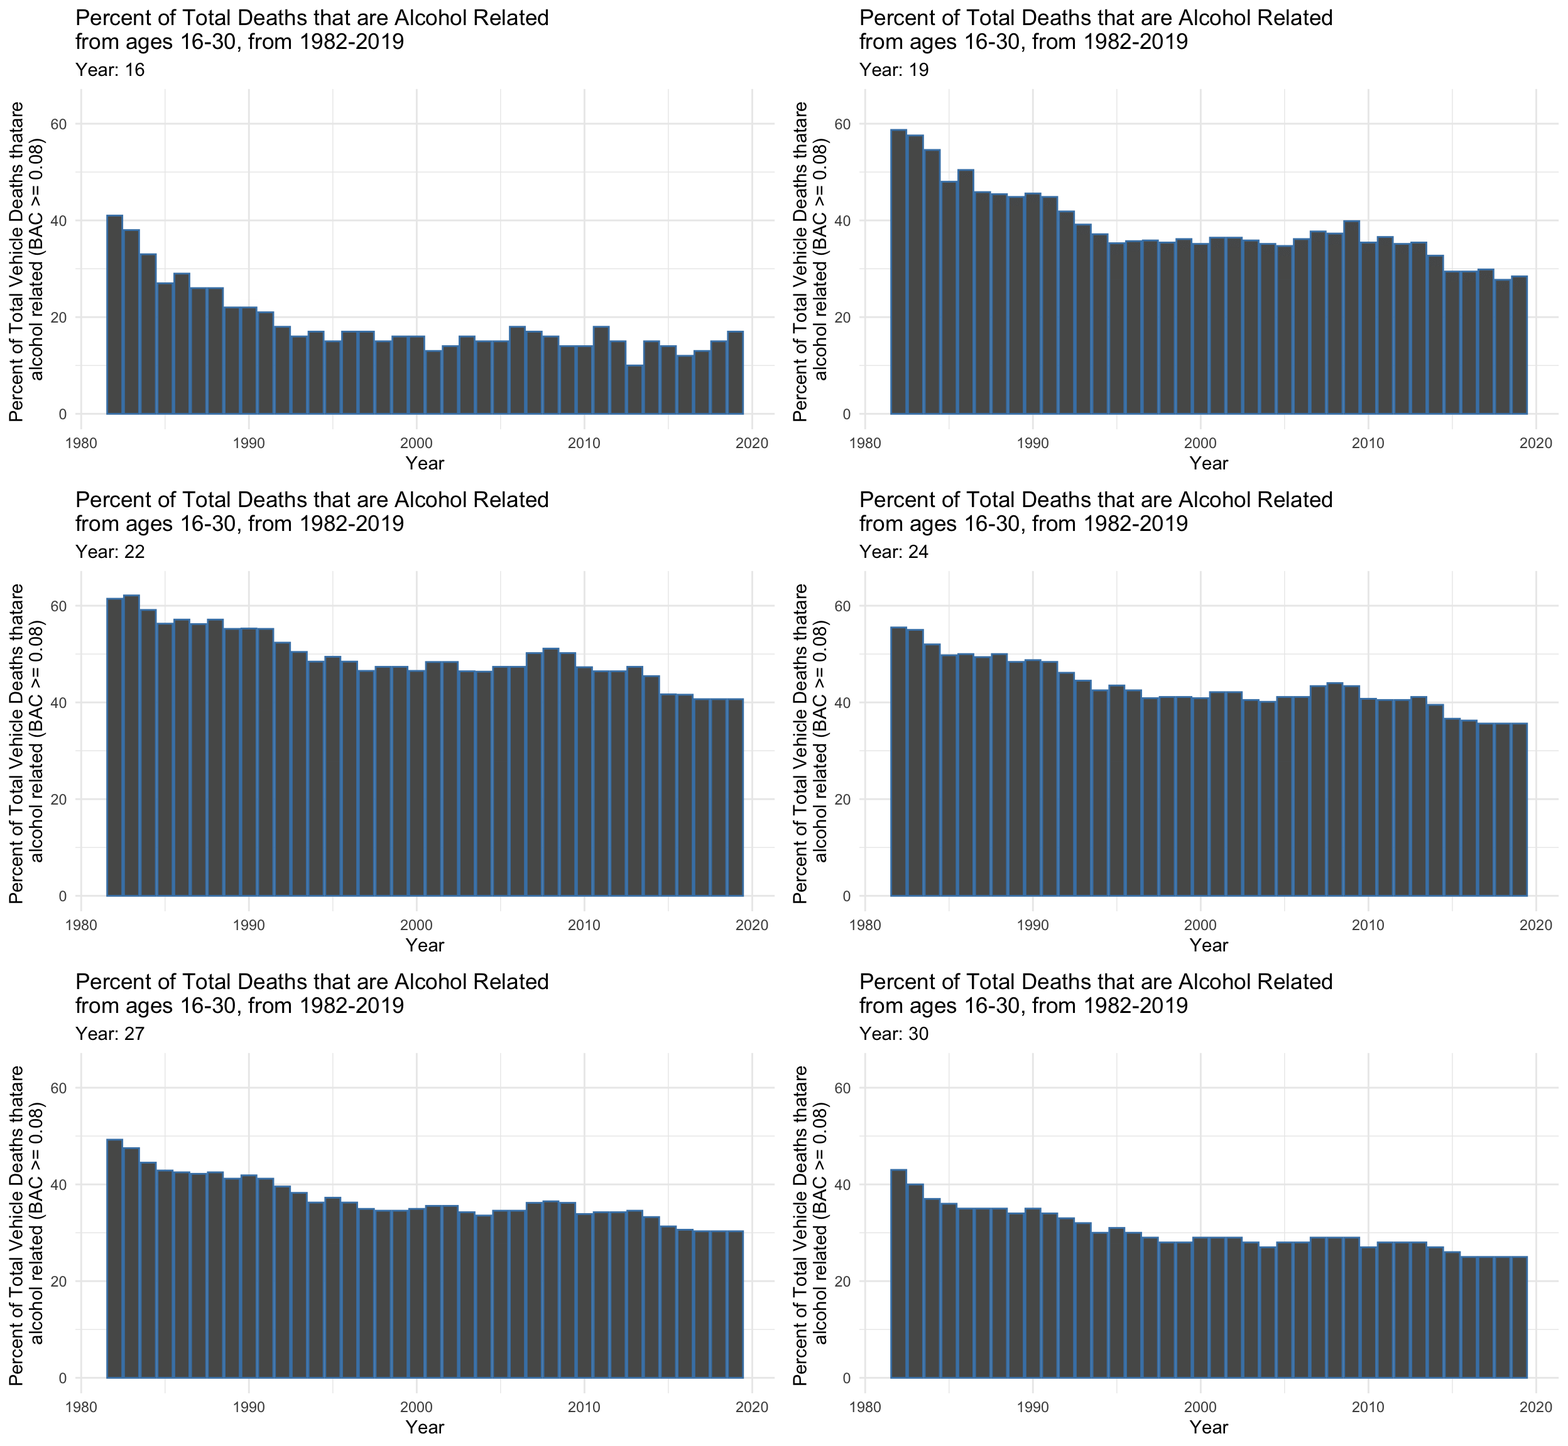
This graph shows that total number of deaths from the years 1982 to 2019. The graph shows the total deaths for the ages 16,18,21 and 30 and above. Each graph also shows how much of the total deaths are caused by having a blood alchohol concentration(BAC) of 0.08 percent or higher, otherwise known as drinking and driving.

Taking a closer look at the percentages, as age increases, the percentage of alcohol related deaths increase, then decrease. But the overall trend is positive, which means that alcohol is a more prevalent cause in vehicle deaths.
